Geographical Information System
EMS is a system designed to capture, store, manipulate, analyze, manage, and present all types of spatial or geographical data.
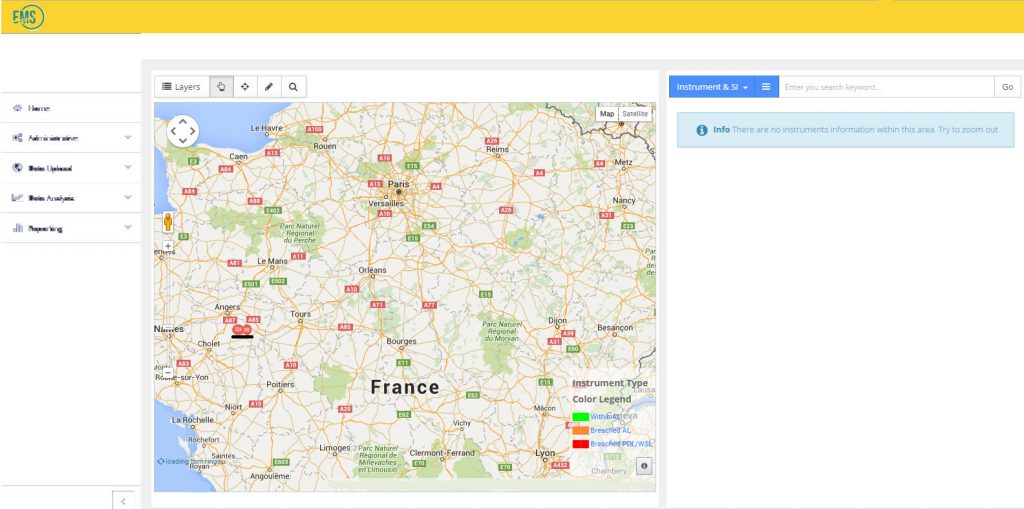
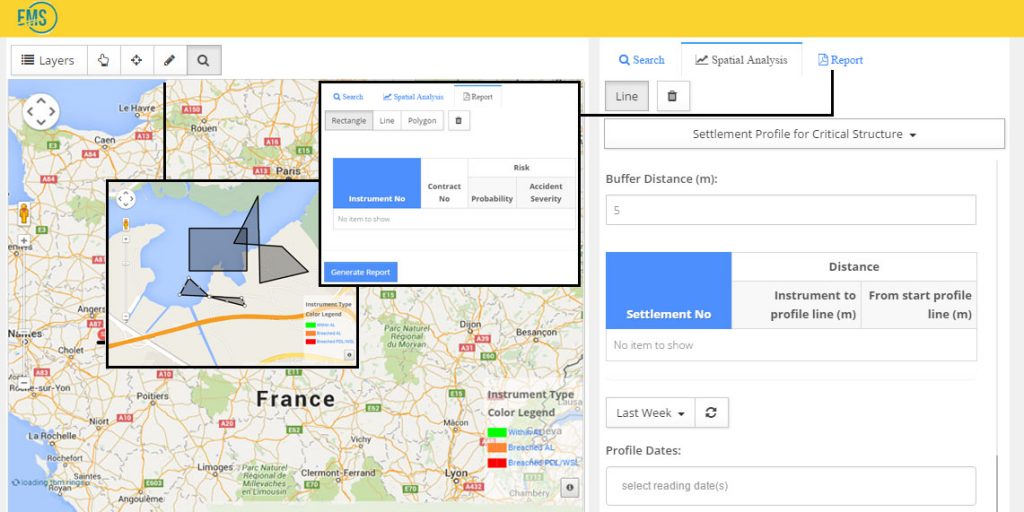
The red dot (as underline) shows that there’s instruments. We use FRANCE as an example.
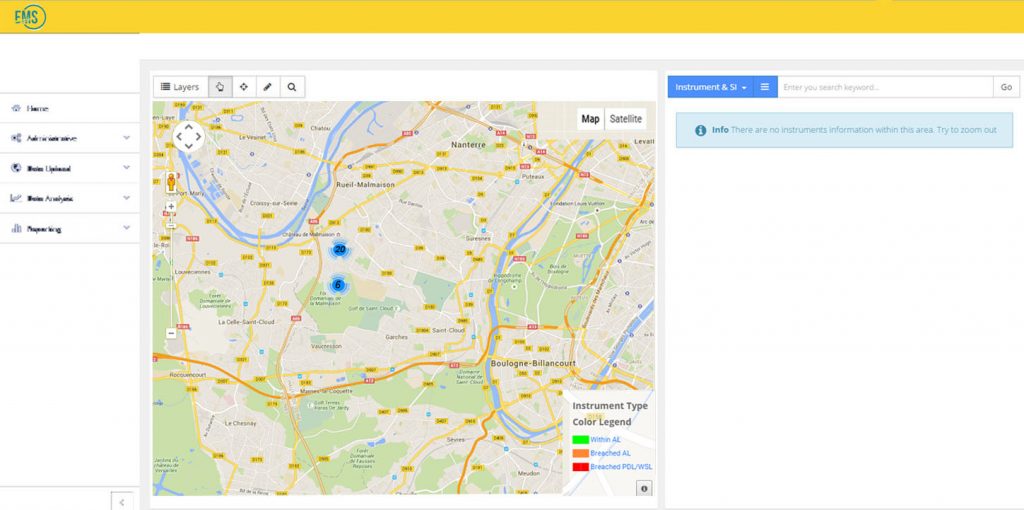
It indicates instruments were placed at area 20 & 6.
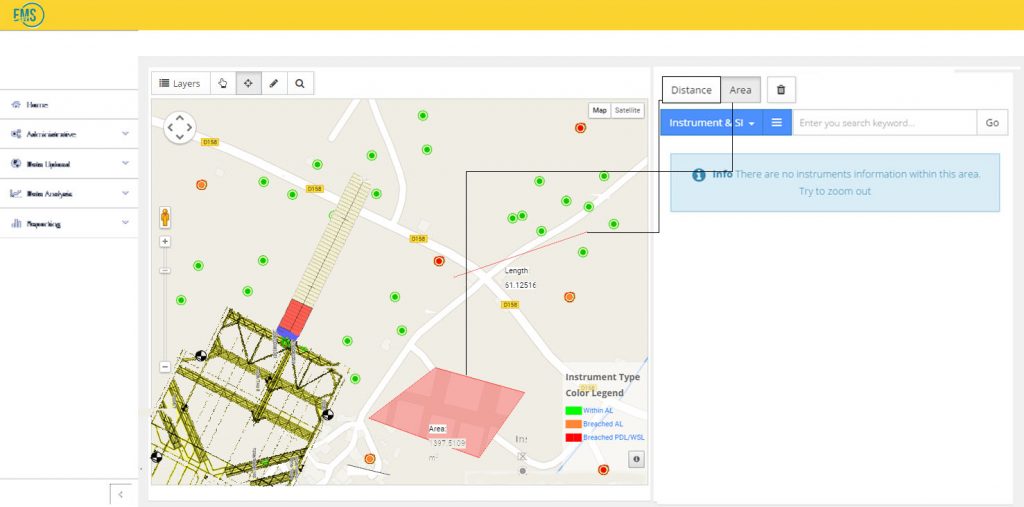
Users are able to know the distance and area by using the 3rd tool (as shown above)
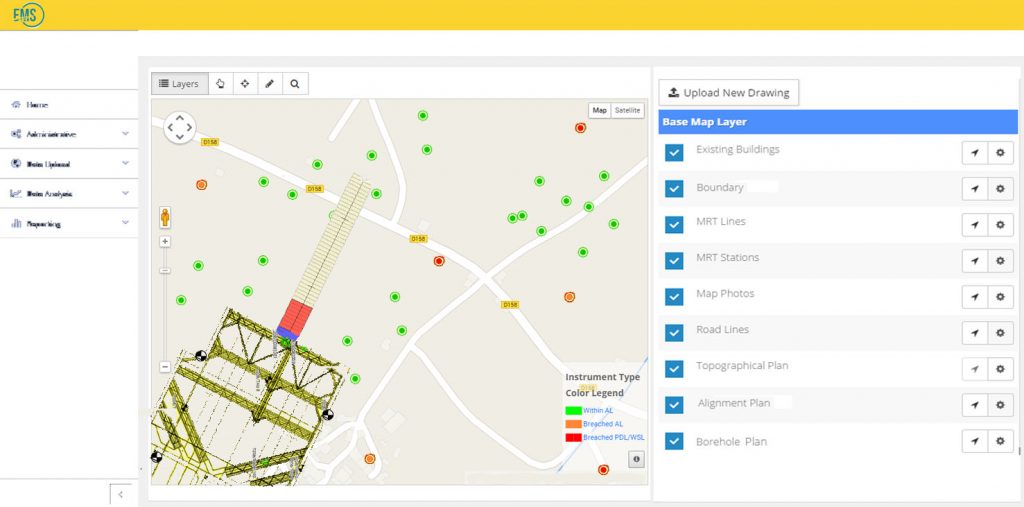
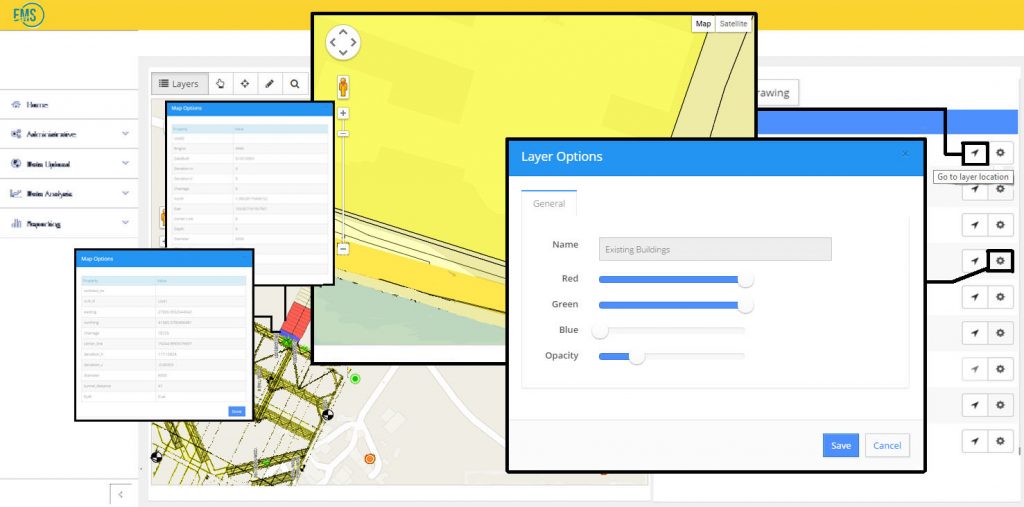
Get location, it will clearly zoom into that section you’re looking for. An example above, it’s existing building layer. So, once you click on it, it will zoom you and show you the exact location.
More info on report, please refer to: Analysis
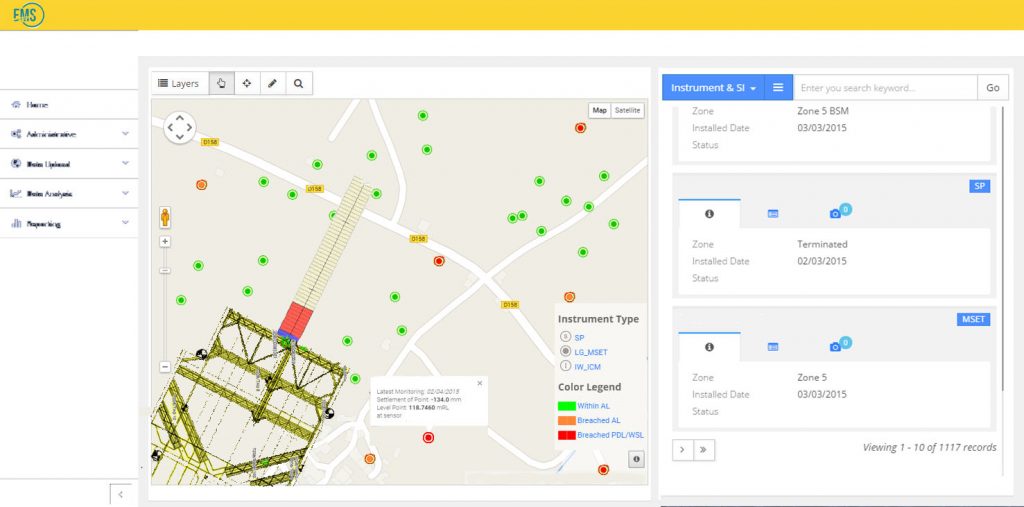
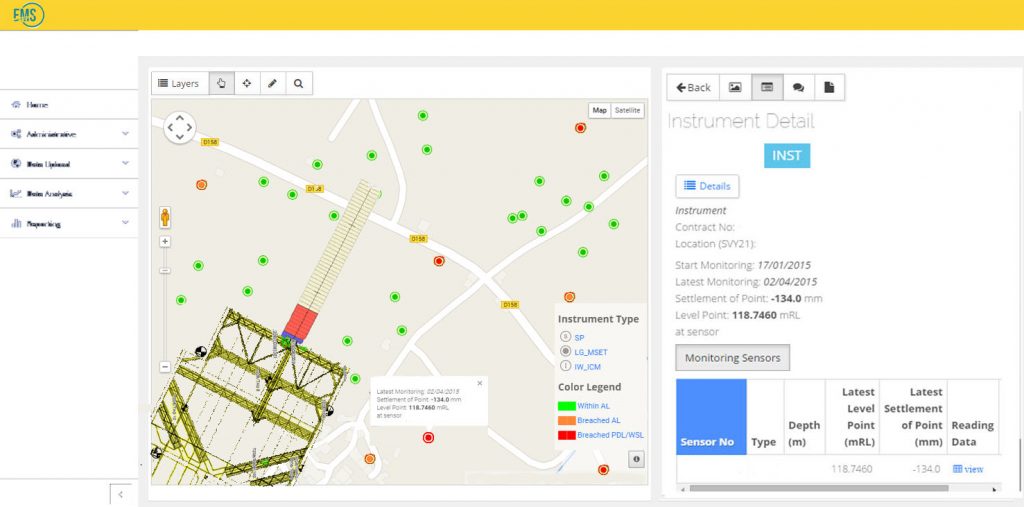
Mouse over any instrument, users are able to monitor them individually.
green = ok. red = need attention
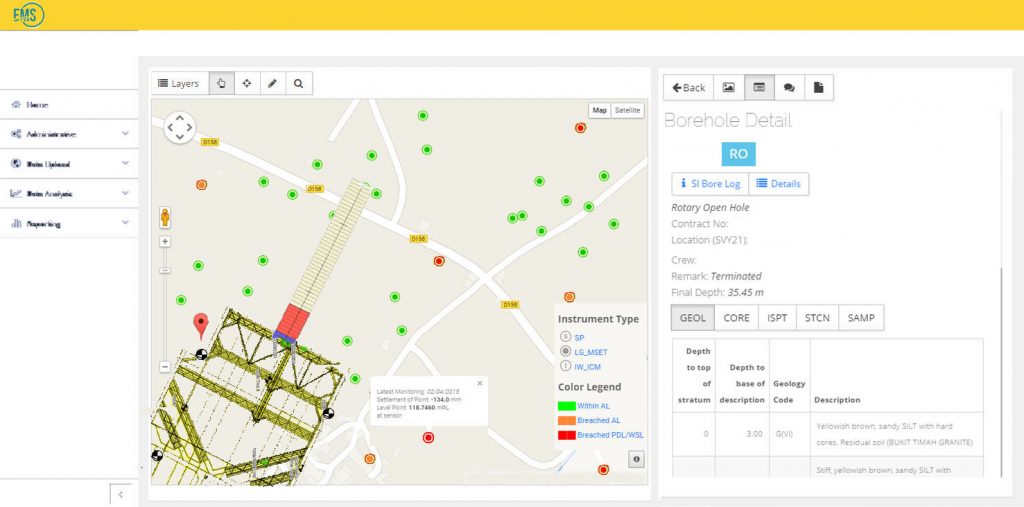
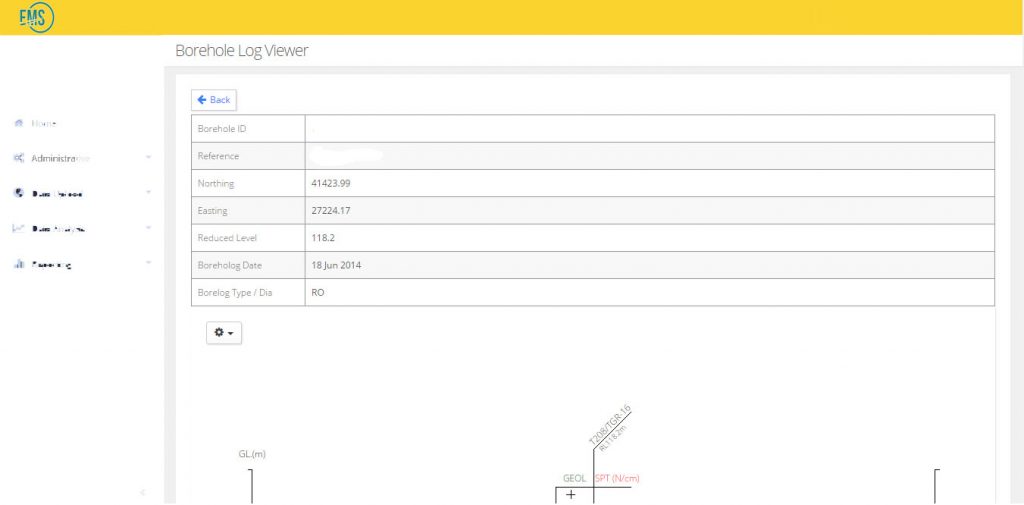
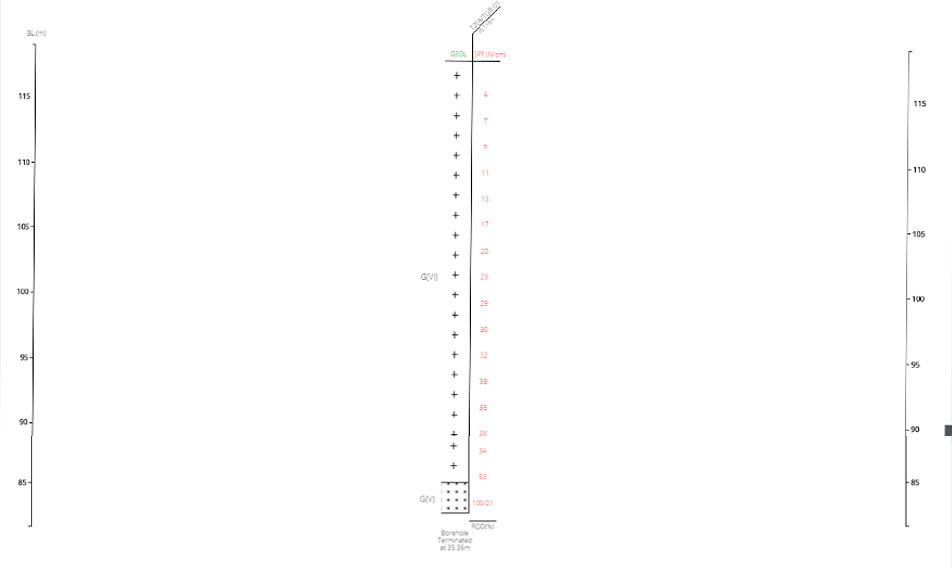
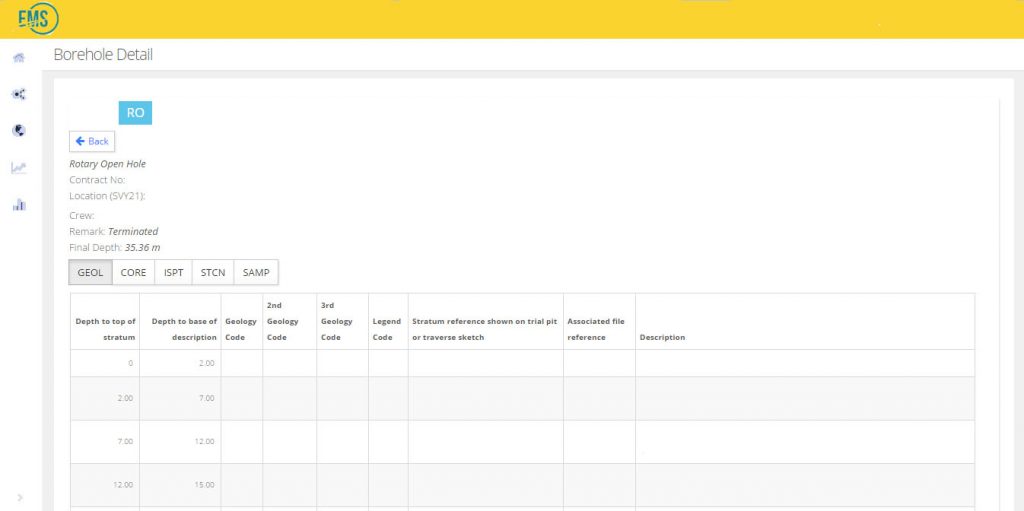
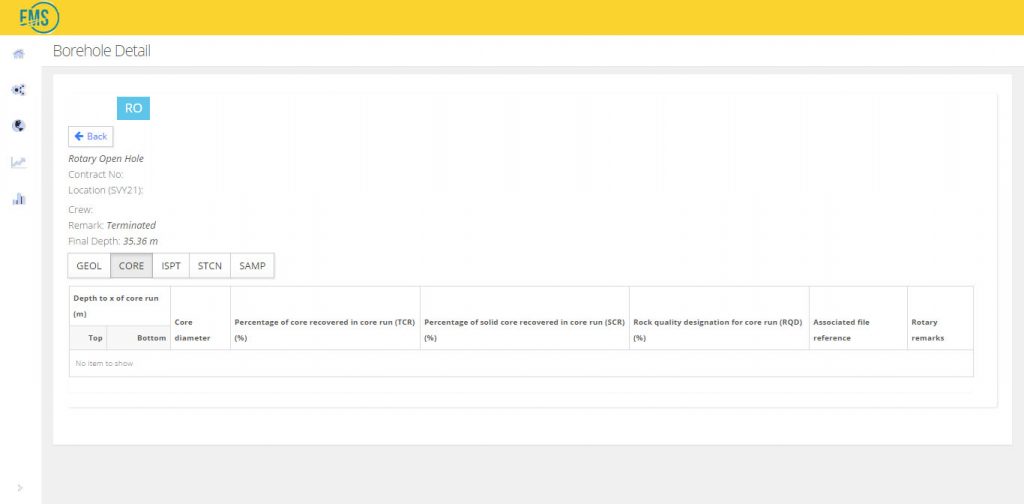
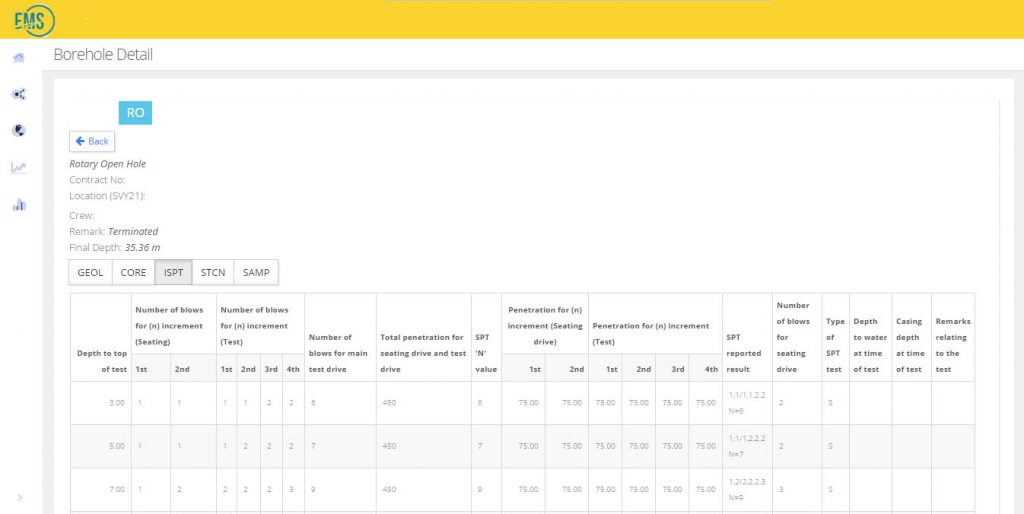
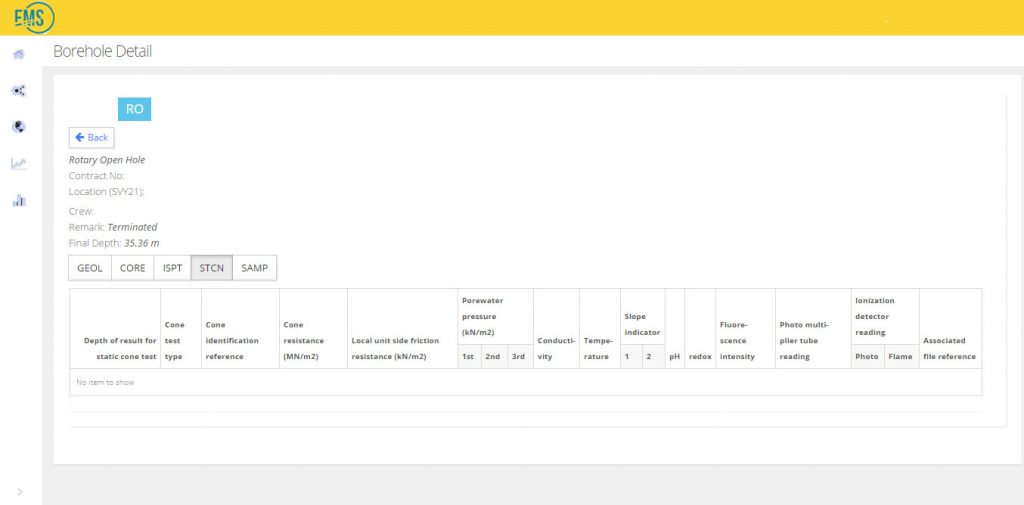
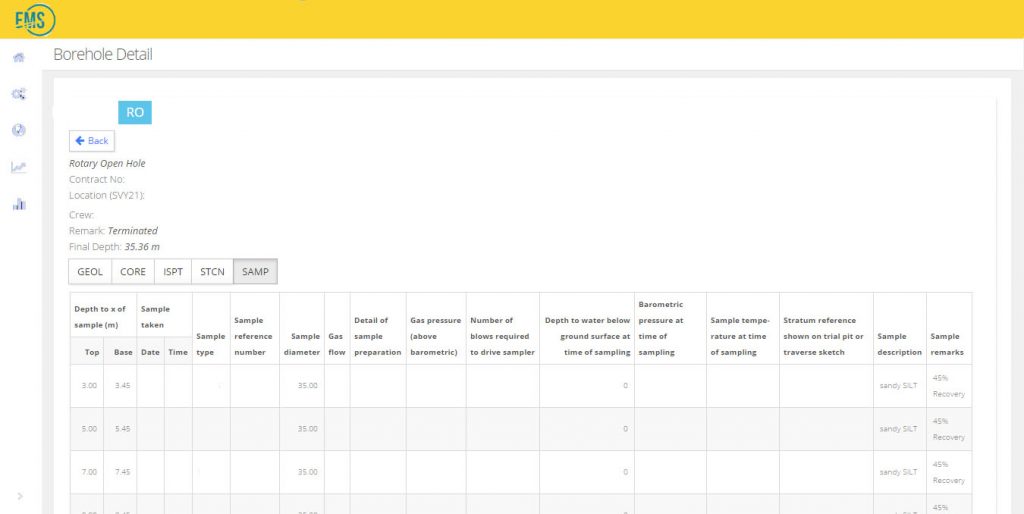
Mouse over rotary open hole, users will be able to see the SI Bore Log & details as shown below as shown below.
SI BORE LOG
DETAILS
GEOL
CORE
ISPT
STCN
SAMP

 English
  China
China  Japan
Japan 